
TAM $95B, SAM $15.4B, SOM $881M a year: the West Coast demand audit, November 2026.
Every apartment and townhome permitted in California, Oregon and Washington, counted from Census files. Dollars use the Portland prototype home, 694 square feet, so they run low.
Apartment permits swing with the cycle, and 2025 was near the bottom.
Homes in buildings of two or more units, three states.[4] January to September 2026 ran 26% ahead of 2025.
| 2025 | 2 to 4 units | 5+ units | All homes |
|---|---|---|---|
| California | 4,633 | 41,484 | 103,856 |
| Oregon | 699 | 4,925 | 14,839 |
| Washington | 2,132 | 15,001 | 34,913 |
22 metros along I-5 and CA-99 hold 82% of apartment permits.
Homes in 5+ unit buildings, 2025.[7]
The states' targets add up to about 391,000 homes a year.
| State | Target a year | Permitted 2025 | Short by |
|---|---|---|---|
| California: 2.5 million over about 8 years[1] | 312,500 | 103,856 | 208,644 |
| Washington: "more than 50,000" a year[2] | 50,000 | 34,913 | 15,087 |
| Oregon: 491,347 over 20 years[3] | 29,359 | 14,839 | 14,520 |
| Total | 391,859 | 153,608 | 238,251 |
California's allocation is a duty to zone, not to build; dividing by eight years is our approximation.
New laws open rail corridors, malls and office parks.
| California SB 79 | Up to 75 feet near heavy-rail stations, from July 2026[8] |
| California AB 2011 | Housing by right on commercial land, including malls; 1.6 to 2.4 million homes of capacity[9] |
| Washington HB 1491 | About six stories near rail[10] |
| Single stair | Washington six stories, Oregon four by local option, California none yet[11] |
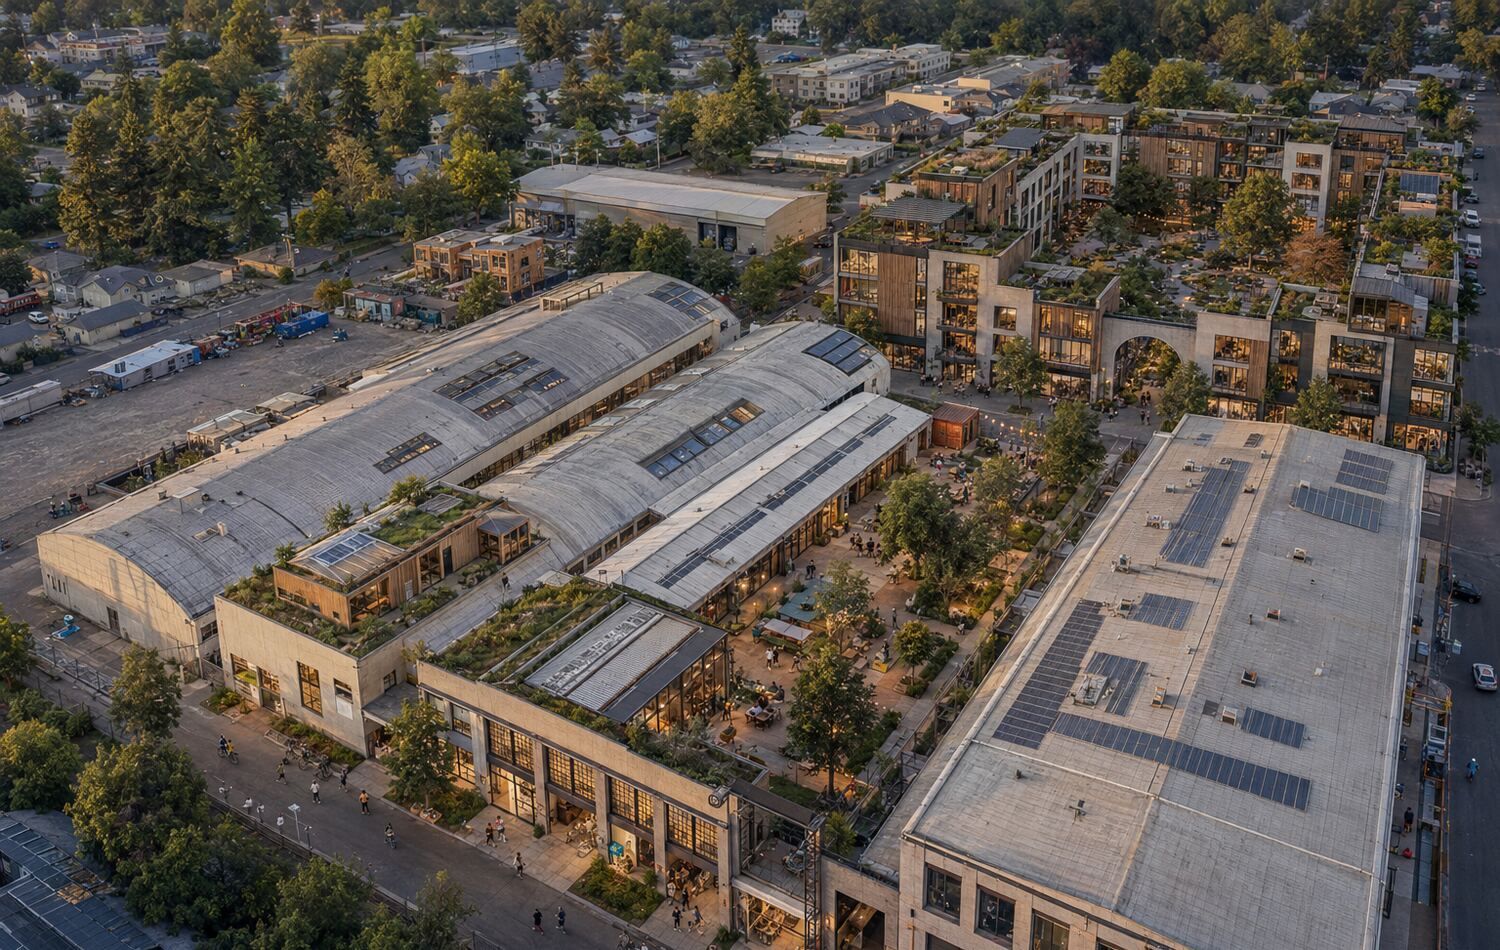
240,000 homes on transit land
The maximum on land California transit agencies own.[12] BART and Sound Transit have delivered about 8,000 so far.[13]
15,400 homes on six malls
Stonestown, Vallco, Westminster, Lloyd Center, Northgate and Tanforan.[14]
26 to 28% of offices vacant
San Francisco, Seattle and Portland, Q3 2026.[15]
Method: a source and date on every figure, our arithmetic labeled as ours, gaps stated rather than filled.
Sources
- California HCD, Statewide Housing Plan (2022): about 2.5 million homes over the sixth housing cycle, as reported by CalMatters, August 2026. https://calmatters.org/housing/2026/08/california-rhna-housing-affordable-progress/
- Washington Department of Commerce, "Washington state will need more than 1 million homes in next 20 years", March 2023. https://www.commerce.wa.gov/washington-state-will-need-more-than-1-million-homes-in-next-20-years/
- Oregon Office of Economic Analysis, Oregon Housing Needs Analysis 2026 production targets, December 2025. https://www.oregon.gov/das/oea/Documents/OHNA-2026-Results-Report.pdf
- US Census Bureau, Building Permits Survey, state annual files 2019 to 2025 and January to September 2026. https://www.census.gov/construction/bps/
- US Census Bureau, Survey of Construction microdata 2019 to 2025 (our tabulation of attached homes, Pacific division). https://www.census.gov/construction/chars/microdata.html
- US Census Bureau, Characteristics of New Housing, multifamily tables, 2025. https://www.census.gov/construction/chars/current.html
- US Census Bureau, Building Permits Survey, metro (CBSA) annual files 2024 and 2025. https://www2.census.gov/econ/bps/CBSA%20(beginning%20Jan%202024)/
- California HCD, "SB 79 Transit-Oriented Development", updated August 2026. https://www.hcd.ca.gov/planning-and-research/sb79-tod
- UrbanFootprint, HDR, Calthorpe, MapCraft and EPS, "Can commercial corridors solve California's housing crisis?", August 2022. https://urbanfootprint.com/ab2011-analysis/
- Futurewise, "HB 1491 FAQ" (Washington transit-oriented development, 2025). https://futurewise.org/tod1491/
- Washington RCW 19.27.115 and WSR 25-23-081; Oregon Building Codes Division, 2025 OSSC Appendix Q (single-exit stair). https://www.oregon.gov/bcd/codes-stand/Documents/25ossc-single-exit-stair-appq.pdf
- Enterprise Community Partners, "Assessing the Potential of Transit Agency-Owned Land for Housing Development in California", March 2026. https://enterprisecommunity.org/sites/default/files/2026-03/Enterprise-Transit-Agency-Land-Use-Report.pdf
- BART Transit-Oriented Development program (2026); Sound Transit, "What is TOD?" (2026). https://www.bart.gov/about/business/tod
- Mall redevelopment plans: Stonestown (CBS News SF, July 2024), The Rise at Vallco (SV@Home, February 2026), Westminster (CoStar), Lloyd Center (Axios Portland, February 2026), Northgate (The Urbanist, 2024), Tanforan (CEQAnet SCH 2023120409). https://cbsnews.com/sanfrancisco/news/sf-stonestown-galleria-3500-new-homes-final-approval-board-of-supervisors
- Office vacancy, Q3 2026: CBRE San Francisco, CBRE Portland, Kidder Mathews Seattle and San Diego, TenantBase Los Angeles. https://www.cbre.com/insights/figures/san-francisco-office-figures-q3-2026